

The stacked plot in Figure 3.20 shows the numbers of higher education students enrolled in public and
Question:
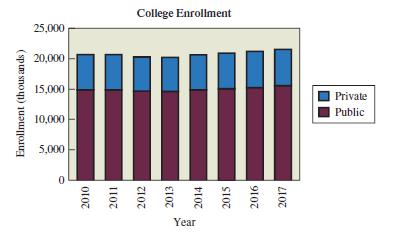
The stacked plot in Figure 3.20 shows the numbers of higher education students enrolled in public and private colleges. The last few bars are projections from the U.S. National Center for Education Statistics.
a. Describe any trends revealed on this graphic.
b. Redraw the graph as a multiple line chart. Briefly discuss the advantages and disadvantages of the two different representations of this particular data set.
Fantastic news! We've Found the answer you've been seeking!
Step by Step Answer:
a Trends The total enrollment in higher education institutions appears relatively stable over the ye...View the full answer

Answered By
Gilbert Chesire
I am a diligent writer who understands the writing conventions used in the industry and with the expertise to produce high quality papers at all times. I love to write plagiarism free work with which the grammar flows perfectly. I write both academics and articles with a lot of enthusiasm. I am always determined to put the interests of my customers before mine so as to build a cohesive environment where we can benefit from each other. I value all my clients and I pay them back by delivering the quality of work they yearn to get.
14+ Reviews
49+ Question Solved
Related Book For 

Statistical Reasoning For Everyday Life
ISBN: 978-0134494043
5th Edition
Authors: Jeff Bennett, William Briggs, Mario Triola
Question Posted:
