

The following graph portrays the distribution of the number of spicy chicken sandwiches sold at a nearby
Question:
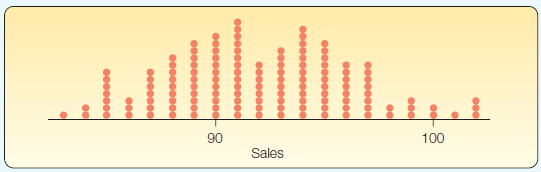
If we use the Empirical Rule, sales will be between what two values on 68% of the days? Sales will be between what two values on 95% of the days?
DistributionThe word "distribution" has several meanings in the financial world, most of them pertaining to the payment of assets from a fund, account, or individual security to an investor or beneficiary. Retirement account distributions are among the most...
Fantastic news! We've Found the answer you've been seeking!
Step by Step Answer:
8723 and 9657 found by ...View the full answer

Answered By
William Otieno
I am a professional tutor and a writer with excellent skills that are important in serving the bloggers and other specialties that requires a great writer. The important aspects of being the best are that I have served so many clients with excellence
With excellent skills, I have acquired very many recommendations which have made it possible for me to survive as an excellent and cherished writer. Being an excellent content writer am also a reputable IT writer with essential skills that can make one turn papers into excellent result.
83+ Reviews
354+ Question Solved
Related Book For 

Statistical Techniques in Business and Economics
ISBN: 978-1259666360
17th edition
Authors: Douglas A. Lind, William G Marchal
Question Posted:
