

The following data show the number of Netflix subscribers worldwide for the years 2012 (period 1) to
Question:
The following data show the number of Netflix subscribers worldwide for the years 2012 (period 1) to 2017 (period 6) (datawrapper website). The data are in the file NetflixSubscribers.
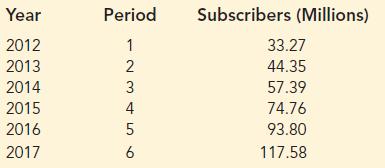
a. Construct a time-series plot. What type of pattern exists in the data?
b. Develop a linear trend equation for this time series.
c. Develop a quadratic trend equation for this time series.
d. Compare the MSE for each model. Which model appears better according to MSE?
e. Use the models in part (b) and (c) to forecast subscribers for 2018.
f. Which of the two forecasts in part e would you use? Explain.
Fantastic news! We've Found the answer you've been seeking!
Step by Step Answer:
a The timeseries plot shows an upward trend b c d Linear model MS...View the full answer

Answered By
Muhammad Umair
I have done job as Embedded System Engineer for just four months but after it i have decided to open my own lab and to work on projects that i can launch my own product in market. I work on different softwares like Proteus, Mikroc to program Embedded Systems. My basic work is on Embedded Systems. I have skills in Autocad, Proteus, C++, C programming and i love to share these skills to other to enhance my knowledge too.
1+ Reviews
10+ Question Solved
Related Book For 

Statistics For Business & Economics
ISBN: 9781337901062
14th Edition
Authors: David R. Anderson, Dennis J. Sweeney, Thomas A. Williams, Jeffrey D. Camm, James J. Cochran
Question Posted:
