

The following table reports prices and usage quantities for two items in 2016 and 2018. a. Compute
Question:
The following table reports prices and usage quantities for two items in 2016 and 2018.
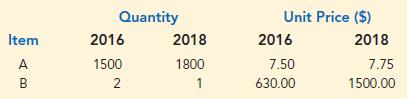
a. Compute price relatives for each item in 2018 using 2016 as the base period.
b. Compute an unweighted aggregate price index for the two items in 2018 using 2016 as the base period.
c. Compute a weighted aggregate price index for the two items using the Laspeyres method.
d. Compute a weighted aggregate price index for the two items using the Paasche method.
Fantastic news! We've Found the answer you've been seeking!
Step by Step Answer:
a Item Price Relative ...View the full answer

Answered By
Shebla K
I am an MBA graduate having experience as an Assistant Professor at University level for two years. I always prepare well for a class as I believe that only if you become an ocean you can give a bucket of water. Being a teacher was not only my profession but also my passion.
1+ Reviews
10+ Question Solved
Related Book For 
Statistics For Business & Economics
ISBN: 9781337901062
14th Edition
Authors: David R. Anderson, Dennis J. Sweeney, Thomas A. Williams, Jeffrey D. Camm, James J. Cochran
Question Posted:
