

The movie industry is a competitive business. More than 50 studios produce hundreds of new movies for
Question:
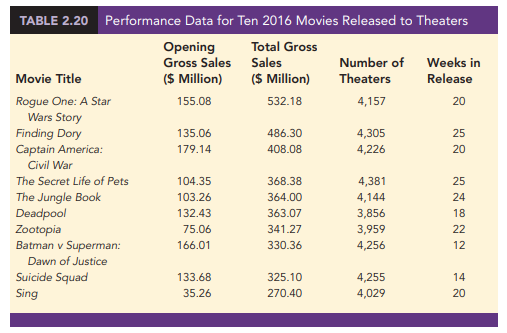
The movie industry is a competitive business. More than 50 studios produce hundreds of new movies for theater release each year, and the financial success of each movie varies considerably. The opening weekend gross sales ($ millions), the total gross sales ($ millions), the number of theaters the movie was shown in, and the number of weeks the movie was in release are common variables used to measure the success of a movie released to theaters. Data collected for the top 100 theater movies released in 2016 are contained in the file Movies2016 (Box Office Mojo website). Table 2.20 shows the data for the first 10 movies in this file.?
Managerial Report?
Use the tabular and graphical methods of descriptive statistics to learn how these variables contribute to the success of a motion picture. Include the following in your report.?
1. Tabular and graphical summaries for each of the four variables along with a discussion of what each summary tells us about the movies that are released to theaters.?
2. A scatter diagram to explore the relationship between Total Gross Sales and Opening Weekend Gross Sales. Discuss.?
3. A scatter diagram to explore the relationship between Total Gross Sales and Number of Theaters. Discuss.?
4. A scatter diagram to explore the relationship between Total Gross Sales and Number of Weeks in Release. Discuss.
Step by Step Answer:
This case provides the student with the opportunity to use tabular and graphical presentations to analyze data from the movie industry Developing and interpreting frequency distributions percent frequ...View the full answer


Statistics For Business & Economics
ISBN: 9781337901062
14th Edition
Authors: David R. Anderson, Dennis J. Sweeney, Thomas A. Williams, Jeffrey D. Camm, James J. Cochran
