

Following are measurements of soil concentrations (in mg/kg) of chromium (Cr) and nickel (Ni) at 20 sites
Question:
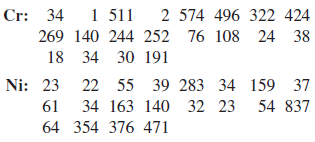
a. Construct a histogram for each set of concentrations.
b. Construct comparative boxplots for the two sets of concentrations.
c. Using the boxplots, what differences can be seen between the two sets of concentrations?
Fantastic news! We've Found the answer you've been seeking!
Step by Step Answer:
a Here are histograms for each group Other choices for the endpoints are possible b c The concentra...View the full answer

Answered By
Hamza Amjad
Currently I am student in master degree program.from last two year I am tutring in Academy and I tought many O/A level student in home tution.
3+ Reviews
10+ Question Solved
Related Book For 
Question Posted:
