

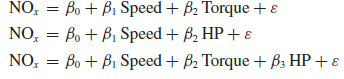
In a laboratory test of a new engine design, the emissions rate (in mg/s of oxides of
Question:
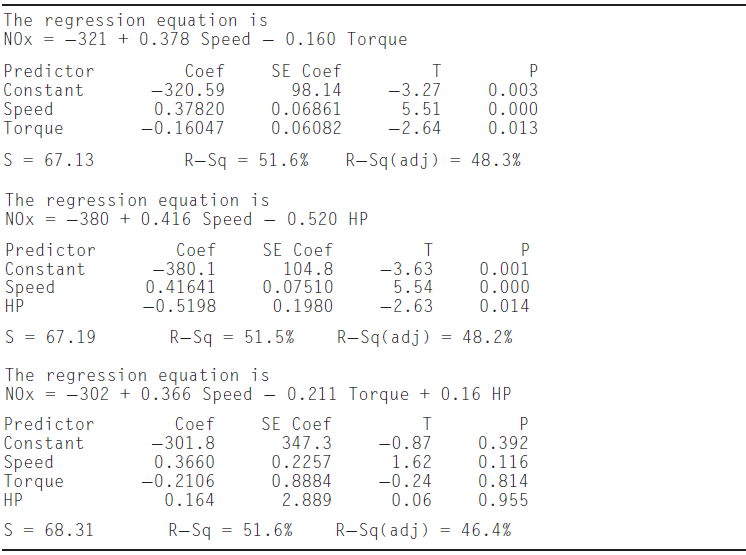
Of the variables Speed, Torque, and HP, which two are most nearly collinear? How can you tell?
Fantastic news! We've Found the answer you've been seeking!
Step by Step Answer:
Torque and HP are most nearly collinear We can ...View the full answer

Answered By
Issa Shikuku
I have vast experience of four years in academic and content writing with quality understanding of APA, MLA, Harvard and Chicago formats. I am a dedicated tutor willing to hep prepare outlines, drafts or find sources in every way possible. I strive to make sure my clients follow assignment instructions and meet the rubric criteria by undertaking extensive research to develop perfect drafts and outlines. I do this by ensuring that i am always punctual and deliver quality work.
6+ Reviews
13+ Question Solved
Related Book For 
Question Posted:
