

Samples of eight bolts are taken periodically, and their diameters (in mm) are measured. The following table
Question:
Samples of eight bolts are taken periodically, and their diameters (in mm) are measured. The following table presents the means, ranges, and standard deviations for 25 consecutive samples.
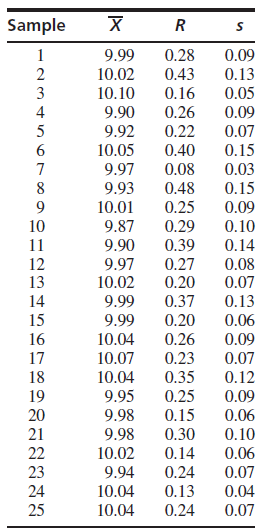
The means are X̅ = 9.9892, R = 0.2628, and s̅ = 0.0880.
a. Calculate the 3σ control limits for the R̅ chart. Is the variance under control? If not, delete the samples that are out of control and recompute X̅ and R.
b. Based on the sample range R̅, calculate the 3σ control limits for the X̅ chart. Based on the 3σ limits, is the process mean in control? If not, when is it first detected to be out of control?
c. Based on the Western Electric rules, is the process mean in control? If not, when is it first detected to be out of control?
Fantastic news! We've Found the answer you've been seeking!
Step by Step Answer:
a The sample size is n 8 The upper and lower limits for the Rchart are ...View the full answer

Answered By
Muhammad Umair
I have done job as Embedded System Engineer for just four months but after it i have decided to open my own lab and to work on projects that i can launch my own product in market. I work on different softwares like Proteus, Mikroc to program Embedded Systems. My basic work is on Embedded Systems. I have skills in Autocad, Proteus, C++, C programming and i love to share these skills to other to enhance my knowledge too.
1+ Reviews
10+ Question Solved
Related Book For 
Question Posted:
