

The following MINITAB output presents the results of a hypothesis test for the difference p 1 ??
Question:
The following MINITAB output presents the results of a hypothesis test for the difference p1?? p2between two population proportions.
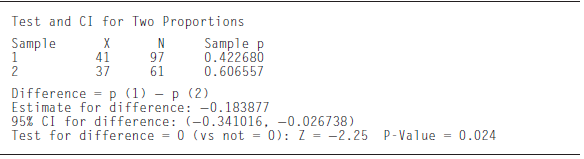
a. Is this a one-tailed or two-tailed test?
b. What is the null hypothesis?
c. Can H0 be rejected at the 5% level? How can you tell?
Fantastic news! We've Found the answer you've been seeking!
Step by Step Answer:
a Twotailed The alternat...View the full answer

Answered By
Nyron Beeput
I am an active educator and professional tutor with substantial experience in Biology and General Science. The past two years I have been tutoring online intensively with high school and college students. I have been teaching for four years and this experience has helped me to hone skills such as patience, dedication and flexibility. I work at the pace of my students and ensure that they understand.
My method of using real life examples that my students can relate to has helped them grasp concepts more readily. I also help students learn how to apply their knowledge and they appreciate that very much.
1+ Reviews
10+ Question Solved
Related Book For 
Question Posted:
