

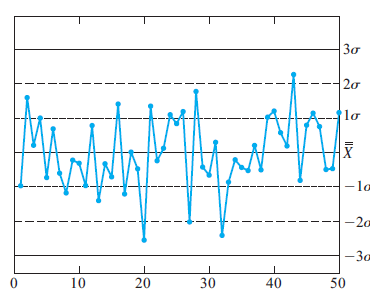
The following X chart depicts the last 50 samples taken from the output of a process. Using
Question:
The following X̅ chart depicts the last 50 samples taken from the output of a process. Using the Western Electric rules, is the process detected to be out of control at any time? If so, specify at which sample the process is first detected to be out of control and which rule is violated.
Fantastic news! We've Found the answer you've been seeking!
Step by Step Answer:
The pro...View the full answer

Answered By
Amit Choudhary
I'm new in this profession regarding online teaching but previously i used to teach students near my college. I am teaching on online platform since last year and got good support from the students. I'm teaching on platforms like chegg and vedantu and also at my home in free time.
1+ Reviews
10+ Question Solved
Related Book For 
Question Posted:
