

A Harris Corporation/University of Florida study was undertaken to determine whether a manufacturing process performed at a
Question:
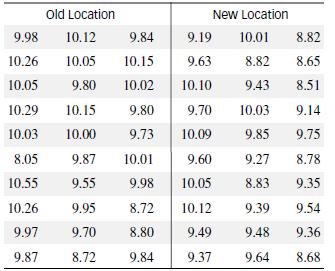
A Harris Corporation/University of Florida study was undertaken to determine whether a manufacturing process performed at a remote location can be established locally. Test devices (pilots) were set up at both the old and new locations and voltage readings on the process were obtained. A “good process” was considered to be one with voltage readings of at least 9.2 volts (with larger readings being better than smaller readings). The table contains voltage readings for 30 production runs at each location.
a. Construct a relative frequency histogram for the voltage readings of the old process.
b. Construct a stem-and-leaf display for the voltage readings of the old process. Which of the two graphs in parts a and b is more informative about where most of the voltage readings lie?
c. Construct a relative frequency histogram for the voltage readings of the new process.
d. Compare the two graphs in parts a and c. (You may want to draw the two histograms on the same graph.) Does it appear that the manufacturing process can be established locally (i.e., is the new process as good as or better than the old)?
e. Find and interpret the mean, median, and mode for each of the voltage readings data sets. Which is the preferred measure of central tendency? Explain.
f. Calculate the z-score for a voltage reading of 10.50 at the old location.
g. Calculate the z-score for a voltage reading of 10.50 at the new location.
h. Based on the results of parts f and g, at which location
is a voltage reading of 10.50 more likely to occur? Explain.
i. Construct a box plot for the data at the old location. Do you detect any outliers?
j. Use the method of z-scores to detect outliers at the old location.
k. Construct a box plot for the data at the new location. Do you detect any outliers?
l. Use the method of z-scores to detect outliers at the new location.
m. Compare the distributions of voltage readings at the two locations by placing the box plots, parts i and k, side by side vertically.
Step by Step Answer:
a To construct a relative frequency histogram we need to determine the intervals and count the number of observations falling within each interval Here is the histogram for the voltage readings of the ...View the full answer


Statistics For Engineering And The Sciences
ISBN: 9781498728850
6th Edition
Authors: William M. Mendenhall, Terry L. Sincich
