

PCBs make up a family of hazardous chemicals that are often dumped, illegally, by industrial plants into
Question:
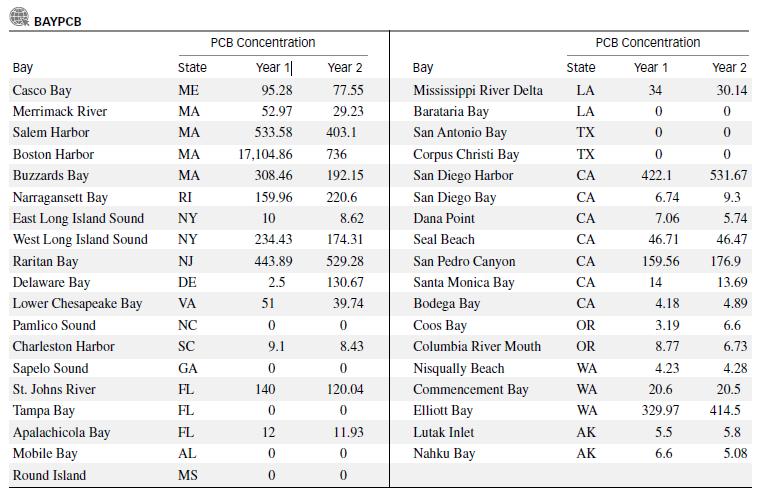
PCBs make up a family of hazardous chemicals that are often dumped, illegally, by industrial plants into the surrounding streams, rivers, or bays. The table below reports the annual concentrations of PCBs (measured in parts per billion) in water samples collected for two consecutive years from 37 U.S. bays and estuaries. An official from the Environmental Protection Agency wants to model the year 2 PCB concentration (y) of a bay as a function of the previous year’s PCB concentration (x).
a. Fit the first-order model, E(y) = βo + β1x, to the data. Give the least-squares prediction equation.
b. Is the model adequate for predicting y? Explain.
c. Construct a residual plot for the data. Do you detect any outliers? If so, identify them.
d. Refer to part c. Although the residual for Boston Harbor is not, by definition, an outlier, the EPA believes that it has strong influence on the regression because of its large y value. Remove the observation for Boston Harbor from the data and refit the model. Has model adequacy improved?
e. An alternative approach is to use the natural log transformations y* = ln(y + 1) and x* = ln(x + 1), and fit the model E(y*) = βo + β1x*. Fit this model, then conduct a test for model adequacy and perform a residual analysis. Interpret the results. In particular, comment on the residual value for Boston Harbor.
Step by Step Answer:

This question has not been answered yet.
You can Ask your question!


Statistics For Engineering And The Sciences
ISBN: 9781498728850
6th Edition
Authors: William M. Mendenhall, Terry L. Sincich
