

Refer to the Journal of Agricultural, Biological, and Environmental Sciences (June 2005) analysis of the Index of
Question:
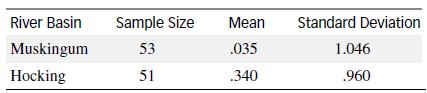
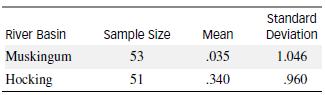
Refer to the Journal of Agricultural, Biological, and Environmental Sciences (June 2005) analysis of the Index of Biotic Integrity (IBI), Exercise 7.42. Recall that the IBI measures the biological condition or health of an aquatic region. Summary data on the IBI for sites located in two Ohio river basins, Muskingum and Hocking, are reproduced in the next table. Conduct a test of hypothesis (at α = .10) to compare the mean IBI values of the two river basins. Explain why the result will agree with the inference derived from the 90% confidence interval, Exercise 7.42.
Data from Exercise 7.42
The Ohio Environmental Protection Agency used the Index of Biotic Integrity (IBI) to measure the biological condition or health of an aquatic region. The IBI is the sum of metrics which measure the presence, abundance, and health of fish in the region. Higher values of the IBI correspond to healthier fish populations.) Researchers collected IBI measurements for sites located in different Ohio river basins. (Journal of Agricultural, Biological, and Environmental Sciences, June 2005.) Summary data for two river basins, Muskingum and Hocking, are given in the table. Use a 90% confidence interval to compare the mean IBI values of the two river basins.
Step by Step Answer:


Statistics For Engineering And The Sciences
ISBN: 9781498728850
6th Edition
Authors: William M. Mendenhall, Terry L. Sincich
