

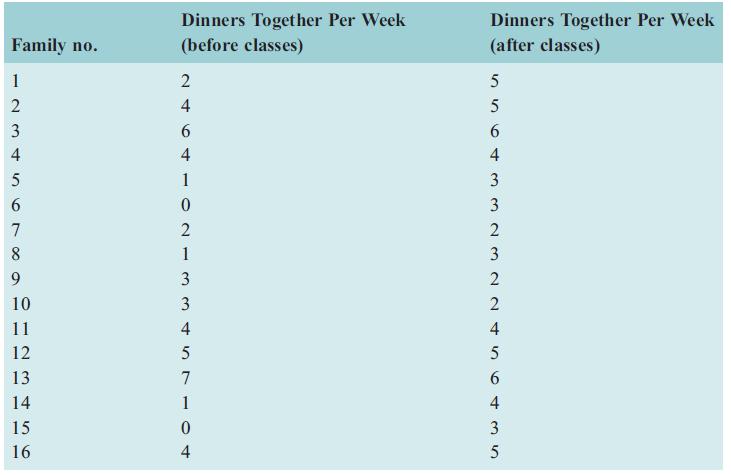
A family science researcher is interested in whether families spend more time together after the parents take
Question:
A family science researcher is interested in whether families spend more time together after the parents take a parenting class. To measure the time families spend together, the researcher collects data on how many dinners per week the family eats together. The results for 16 families are below.
a. Explain why these scores are considered paired data.
b. Find a difference score for each family.
c. Calculate the mean and standard deviation of the difference scores for the families.
d. If we conduct a paired-samples t-test for these data, what would the null hypothesis be?
e. What would the α value be for this NHST?
f. Is a one- or a two-tailed hypothesis appropriate for this scenario? Justify your response.
g. What is the alternative hypothesis for this paired-samples t-test?
h. Calculate the degrees of freedom in this example.
i. Find the tcrit value.
j. Calculate the tobs value for the data.
k. Should you reject or retain the null hypothesis?
l. Calculate Cohen’s d for these data. Use spooled in the standard deviation.
m. Calculate Cohen’s d for these data, using the equation in Sidebar 9.2.
n. Calculate Glass’s Δ for these data.
o. Why might Glass’s Δ be an appropriate effect size for these data?
p. Find a p-value for these data.
Step by Step Answer:
a These scores are considered paired data because they are collected from the same group of families and represent the number of dinners per week for each family before and after they took the parenti...View the full answer


Statistics For The Social Sciences A General Linear Model Approach
ISBN: 9781107576971
1st Edition
Authors: Russell T. Warne
