

Create a pie chart showing the percentage of subjects in Table 3.1 who gave each response for
Question:
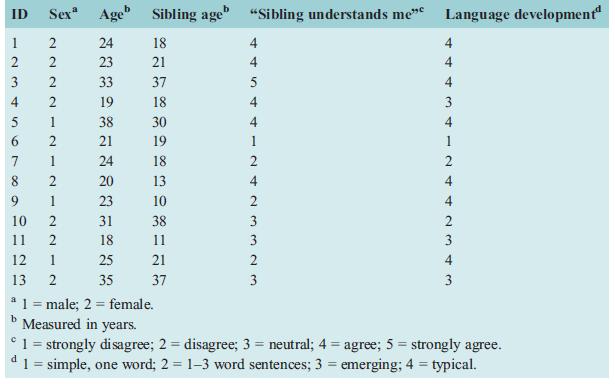
Create a pie chart showing the percentage of subjects in Table 3.1 who gave each response for the language development data in the Waite et al. (2015) study.
Table 3.1
Fantastic news! We've Found the answer you've been seeking!
Step by Step Answer:

Related Book For 

Statistics For The Social Sciences A General Linear Model Approach
ISBN: 9781107576971
1st Edition
Authors: Russell T. Warne
Question Posted:
