

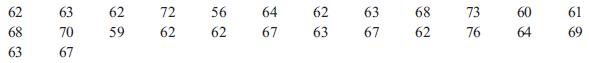
The following data represent the height of 26 statistics students as measured in inches: a. Create a
Question:
The following data represent the height of 26 statistics students as measured in inches:
a. Create a frequency table for these data.
b. Create a histogram for these data with an interval width of 1 unit.
c. Create a frequency polygon for these data with an interval width of 1 unit.
d. Create a histogram for these data with an interval width of 3 units.
e. Create a frequency polygon for these data with an interval width of 3 units.
f. Create a stem-and-leaf plot for these data.
Step by Step Answer:

This question has not been answered yet.
You can Ask your question!
Related Book For 
Statistics For The Social Sciences A General Linear Model Approach
ISBN: 9781107576971
1st Edition
Authors: Russell T. Warne
Question Posted:
