

Computer output giving descriptive statistics for the percent of the population that is obese for each of
Question:
Figure 2.27
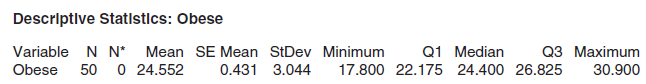
(a) What is the five number summary?
(b) Give the range and the IQR.
(c) What can we conclude from the five number summary about the location of the 15th percentile? The 60th percentile?
Fantastic news! We've Found the answer you've been seeking!
Step by Step Answer:
a We see in the computer output that the five numbe...View the full answer

Answered By
Niala Orodi
I am a competent and an experienced writer with impeccable research and analytical skills. I am capable of producing quality content promptly. My core specialty includes health and medical sciences, but I can competently handle a vast majority of disciplines.
1+ Reviews
10+ Question Solved
Related Book For 

Statistics Unlocking The Power Of Data
ISBN: 9780470601877
1st Edition
Authors: Robin H. Lock, Patti Frazer Lock, Kari Lock Morgan, Eric F. Lock, Dennis F. Lock
Question Posted:
