

Data 2.4 on page 68 introduces the dataset FloridaLakes and discusses the correlation between the acidity (pH)
Question:
(a) What are the null and alternative hypotheses?
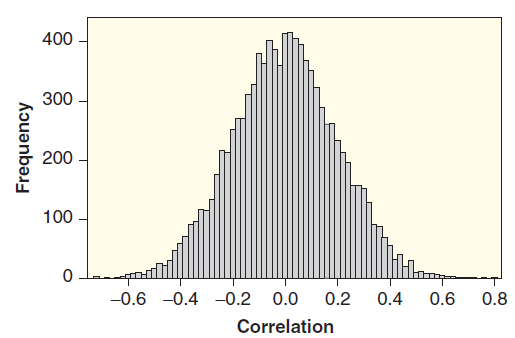
(b) Use Figure B.11 to give a very rough estimate of the sample correlation corresponding to a p-value of 0.30. Explain your reasoning.
(c) Use Figure B.11 to give a very rough estimate of the sample correlation corresponding to a p-value of 0.01. Explain your reasoning.
Figure B.11
Data 2.4 on page 68
The FloridaLakes dataset describes characteristics of water samples taken at n = 53 Florida lakes. Alkalinity (concentration of calcium carbonate in mg/L) and acidity (pH) are given for each lake. In addition, the average mercury level is recorded for a sample of fish (large mouth bass) from each lake. A standardized mercury level is obtained by adjusting the mercury averages to account for the age of the fish in each sample. Notice that the cases are the 53 lakes and that all four variables are quantitative.
DistributionThe word "distribution" has several meanings in the financial world, most of them pertaining to the payment of assets from a fund, account, or individual security to an investor or beneficiary. Retirement account distributions are among the most...
Step by Step Answer:
a Let denote the correlation between pH and mercury in all ...View the full answer


Statistics Unlocking The Power Of Data
ISBN: 9780470601877
1st Edition
Authors: Robin H. Lock, Patti Frazer Lock, Kari Lock Morgan, Eric F. Lock, Dennis F. Lock
