

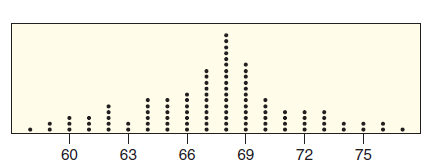
Estimate the mean and the standard deviation for the data in the dotplot in Figure 2.26. Estimate
Question:
Estimate the summary statistics requested, using the histogram in Figure 2.26. There are n = 100 data points included in the dotplot.
Figure 2.26
Fantastic news! We've Found the answer you've been seeking!
Step by Step Answer:
The mean appears to be about 68 Since the data is relatively bellshaped we ...View the full answer

Answered By
Marcus Solomon
I am committed to ensuring that my services always meet the clients' expectations.
82+ Reviews
117+ Question Solved
Related Book For 

Statistics Unlocking The Power Of Data
ISBN: 9780470601877
1st Edition
Authors: Robin H. Lock, Patti Frazer Lock, Kari Lock Morgan, Eric F. Lock, Dennis F. Lock
Question Posted:
