

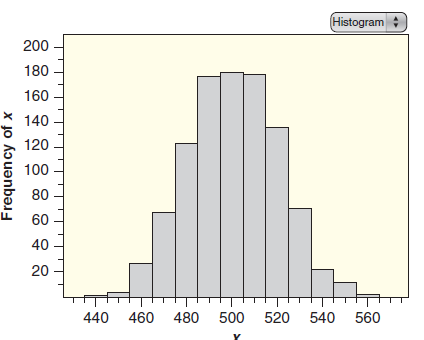
Estimate values at the 10th percentile and the 90th percentile for the data in Figure 2.25. Estimate
Question:
Estimate the summary statistics requested, using the histogram in Figure 2.25. There are n = 100 data points included in the dotplot.
Figure 2.25
Fantastic news! We've Found the answer you've been seeking!
Step by Step Answer:
The 10 th percentile is the value with 10 of the ...View the full answer

Answered By
AJIN KURIAKOSE
I HAVE ELECTRONICS ENGINEERING DEGREE..AND MY AREA OF INTEREST IS MATHEMATICS,CONTROL SYSTEM,NETWORK,DIGITAL
21+ Reviews
32+ Question Solved
Related Book For 

Statistics Unlocking The Power Of Data
ISBN: 9780470601877
1st Edition
Authors: Robin H. Lock, Patti Frazer Lock, Kari Lock Morgan, Eric F. Lock, Dennis F. Lock
Question Posted:
