

Exercise A.16 on page 145 used data in the USStates dataset to examine the percent of adults
Question:
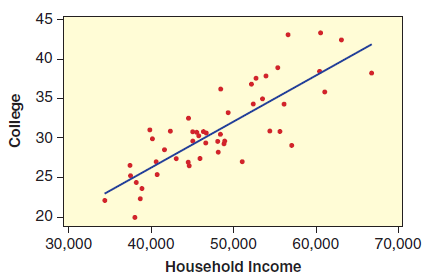
(a) The formula for the regression line is

Interpret the slope of the line in context.
(b) What is the predicted percent to graduate college if 80% graduate high school? What is it if 90% graduate high school?
(c) Massachusetts appears to have a particularly large positive residual. Massachusetts has 86.9% graduating high school and 43.2% graduating college. Compute the residual for Massachusetts.
Exercise A.16
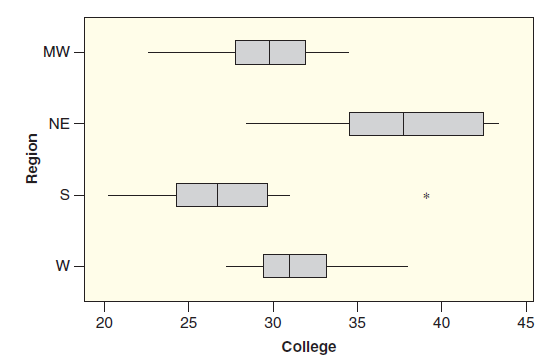
The dataset US States includes information on the percent of the population to graduate from college (of those age 25 and older) for each US state. Figure A.7 shows side-by-side boxplots for percent of college graduates by region of the country (Midwest, Northeast, South, and West.)
Figure A.7
Step by Step Answer:
a The slope 0654 means that for a one percent rise in the high school graduation rate the perc...View the full answer


Statistics Unlocking The Power Of Data
ISBN: 9780470601877
1st Edition
Authors: Robin H. Lock, Patti Frazer Lock, Kari Lock Morgan, Eric F. Lock, Dennis F. Lock
