

Exercise B.8 describes data on ages of husbands and wives at the time of marriage. (a) Do
Question:
(a) Do you expect the correlation between the ages at marriage of husbands and wives to be positive, negative, or near zero? Explain.
(b) Using the data in MarriageAges, find the sample correlation and display the data in a scatterplot. Describe what you observe about the data in the scatterplot.
(c) Use StatKey or other technology to construct and interpret a 95% confidence interval for the correlation between the ages of husbands and wives when they get married.
(d) Does the correlation between ages help address the question in the previous exercise about whether husbands tend to be older than their wives?
Data B.8
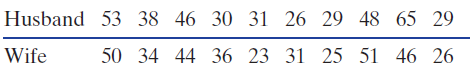
A sample of marriage licenses from 2010 to 2011 in St. Lawrence County in Northern New York State gives the ages of husbands and wives at the time of marriage for 105 newly married couples. The data are stored in MarriageAges and the first few cases from this file are shown in Table B.4. The question of interest is whether or not husbands tend to be older than their wives. Use StatKey or other technology and statistical inference to address this issue based on the questions in parts (a) and (b). In all cases be sure to interpret your findings in the context of this problem, stating to what population (if any) your findings apply.
Table B.4
Step by Step Answer:
a We expect married couples to tend to have similar ages so we expect a positive correlation between ...View the full answer


Statistics Unlocking The Power Of Data
ISBN: 9780470601877
1st Edition
Authors: Robin H. Lock, Patti Frazer Lock, Kari Lock Morgan, Eric F. Lock, Dennis F. Lock
