

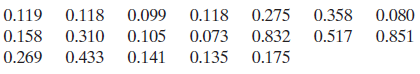
Figure 2.29 shows a dotplot of the arsenic concentrations in Table 2.23. Figure 2.29 Table 2.23 (a)
Question:
Figure 2.29
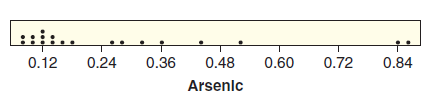
Table 2.23
(a) Which measures of center and spread are most appropriate for this distribution: the mean and standard deviation or the five number summary? Explain.
(b) Is it appropriate to use the general rule about having 95% of the data within two standard deviations for this distribution? Why or why not?
Fantastic news! We've Found the answer you've been seeking!
Step by Step Answer:
a The data is heavily skewed and there appear to b...View the full answer

Answered By
Munir Ahmed Jakhro
I am professional Tutor of of Business Courses, I did my four years Bachelor Degree from one of the Top Business schools of World "Institute of Business Administration" in year 2013. Since then I have been working as Tutor of Accounting, Finance tutor on different online platforms like this website. I am have experience of 6 years teaching business courses to students online and offline my professional job at national savings also helped me in accounting understanding .
8+ Reviews
10+ Question Solved
Related Book For 

Statistics Unlocking The Power Of Data
ISBN: 9780470601877
1st Edition
Authors: Robin H. Lock, Patti Frazer Lock, Kari Lock Morgan, Eric F. Lock, Dennis F. Lock
Question Posted:
