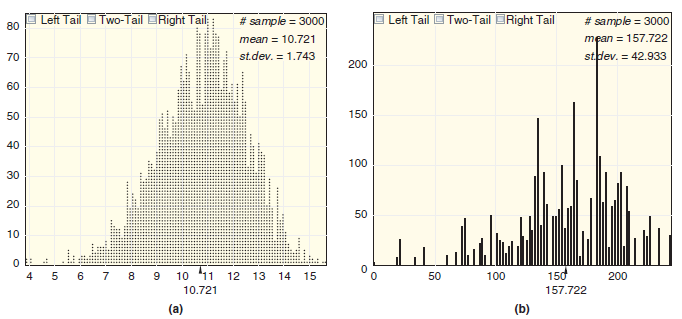
Figure 3.32 shows bootstrap distributions for the standard deviation of two different datasets. In each case, if
Question:
Figure 3.32

(a) Standard deviation of prices of used Mustang cars (in thousands of dollars), introduced in Data 3.4 on page 209, with bootstrap distribution in Figure 3.32(a)
(b) Standard deviation of monthly sales of new Saab cars, introduced in Exercise 3.78 on page 202, with bootstrap distribution in Figure 3.32(b)
The word "distribution" has several meanings in the financial world, most of them pertaining to the payment of assets from a fund, account, or individual security to an investor or beneficiary. Retirement account distributions are among the most...
Fantastic news! We've Found the answer you've been seeking!
Step by Step Answer:
Related Book For 

Statistics Unlocking The Power Of Data
ISBN: 9780470601877
1st Edition
Authors: Robin H. Lock, Patti Frazer Lock, Kari Lock Morgan, Eric F. Lock, Dennis F. Lock
Question Posted:


