

Figure 3.5(b) shows sample means from samples of size n = 30 from a population. Figure 3.5b.
Question:
Figure 3.5b.
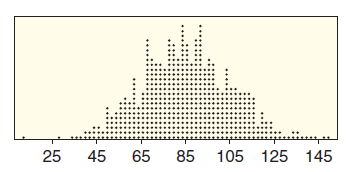
Refer to the sampling distributions given in Figure 3.5. In each case, estimate the value of the population parameter and estimate the standard error for the sample statistic.
Fantastic news! We've Found the answer you've been seeking!
Step by Step Answer:
We expect the sampling distribution to be centered at the value of the ...View the full answer

Answered By
Simon kingori
I am a tier-one market researcher and content developer who has been in this field for the last six years. I’ve run the freelancing gamut; from market research, data mining and SEO/SMM to copywriting, Content Development, you name it, I’ve done it. I’m extremely motivated, organized and disciplined – you have to be to work from home. My experience in Freelancing is invaluable- but what makes me a cut above the rest is my passion to deliver quality results to all my clients- it’s important to note, I've never had a dissatisfied client. Backed by a Masters degree in Computer Science from MOI university, I have the required skill set and burning passion and desire to deliver the best results for my clients. This is the reason why I am a cut above the rest. Having taken a Bsc. in computer science and statistics, I deal with all round fields in the IT category. It is a field i enjoy working in as it is dynamic and new things present themselves every day for research and exploration.
1+ Reviews
10+ Question Solved
Related Book For 

Statistics, Enhanced Unlocking The Power Of Data
ISBN: 9781119308843
2nd Edition
Authors: Robin H Lock, Patti Frazer Lock, Kari Lock Morgan, Eric F Lock, Dennis F Lock
Question Posted:
