

Figure 5.21 shows a bootstrap distribution of correlations between penalty yards and uniform malevolence using the data
Question:
Figure 5.21
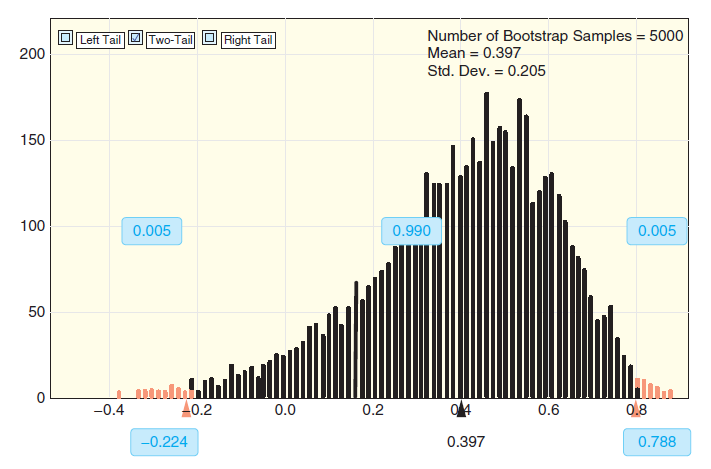 (a) Use the original sample correlation and the standard deviation of the bootstrap distribution shown in Figure 5.21 to compute a 99% confidence interval for the correlation using zˆ— from a normal distribution.
(b) Why is the normal-based interval somewhat different from the percentile interval?
The word "distribution" has several meanings in the financial world, most of them pertaining to the payment of assets from a fund, account, or individual security to an investor or beneficiary. Retirement account distributions are among the most...
Fantastic news! We've Found the answer you've been seeking!
Step by Step Answer:
a For a 99 confidence interval the standard normal value leaving 05 in each tail is z 257...View the full answer

Answered By
Joseph Mwaura
I have been teaching college students in various subjects for 9 years now. Besides, I have been tutoring online with several tutoring companies from 2010 to date. The 9 years of experience as a tutor has enabled me to develop multiple tutoring skills and see thousands of students excel in their education and in life after school which gives me much pleasure. I have assisted students in essay writing and in doing academic research and this has helped me be well versed with the various writing styles such as APA, MLA, Chicago/ Turabian, Harvard. I am always ready to handle work at any hour and in any way as students specify. In my tutoring journey, excellence has always been my guiding standard.
1+ Reviews
10+ Question Solved
Related Book For 

Statistics Unlocking The Power Of Data
ISBN: 9780470601877
1st Edition
Authors: Robin H. Lock, Patti Frazer Lock, Kari Lock Morgan, Eric F. Lock, Dennis F. Lock
Question Posted:
