

Four students were working together on a project and one of the parts involved making a graph
Question:
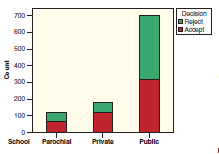
Figure 2.5
a.
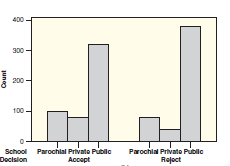
b.
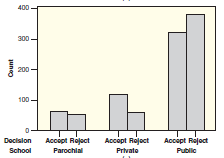
c.
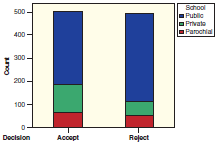
d.
Fantastic news! We've Found the answer you've been seeking!
Step by Step Answer:
Graph b is the impostor It show...View the full answer

Answered By
Isaiah Mutinda
As a graduate with Bs in Maths and Computer Science and having worked as a freelance full stack software developer for 3 years running I believe I have what it takes to conformable tutor and mentor a student to a professional developer also.
2+ Reviews
10+ Question Solved
Related Book For 

Statistics Unlocking The Power Of Data
ISBN: 9780470601877
1st Edition
Authors: Robin H. Lock, Patti Frazer Lock, Kari Lock Morgan, Eric F. Lock, Dennis F. Lock
Question Posted:
