

In Data 2.1 on page 46, we describe a study in which a random sample of 2625
Question:
Table 3.6
Data 2.1 on page 46
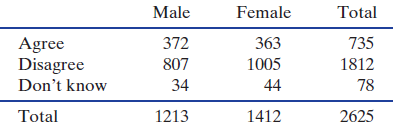
A nationwide US telephone survey conducted by the Pew Foundation in October 2010 asked 2625 adults ages 18 and older €˜€˜Some people say there is only one true love for each person. Do you agree or disagree?€ In addition to finding out the proportion who agree with the statement, the Pew Foundation also wanted to find out if the proportion who agree is different between males and females, and whether the proportion who agree is different based on level of education (no college, some college, or college degree). The survey participants were selected randomly, by landlines and cell phones.
Step by Step Answer:
We are estimating pM pF the difference in proportions between males and ...View the full answer


Statistics, Enhanced Unlocking The Power Of Data
ISBN: 9781119308843
2nd Edition
Authors: Robin H Lock, Patti Frazer Lock, Kari Lock Morgan, Eric F Lock, Dennis F Lock
