

In Exercise A.47, we used the percent of the population graduating high school to predict the percent
Question:
(a) Describe the scatterplot in Figure A.16. Is there a linear trend? Is it positive or negative? Are there any really obvious outliers?
(b) Use Figures A.15 and A.16 to decide which variable, percent to graduate high school or household income, is more strongly correlated with percent to graduate college.
Figure A.15 and A.16
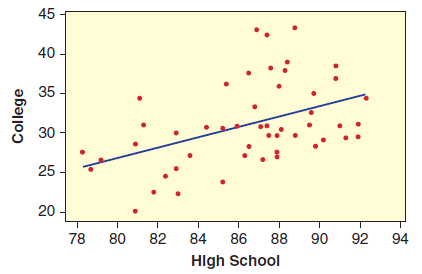
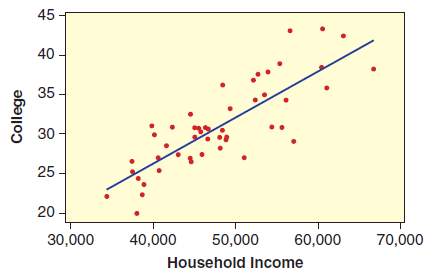
(c) For the state with the largest positive residual, estimate from the graph the household income, the percent graduating college, and the predicted percent to graduate college.
(d) For the state with the largest negative residual, estimate from the graph the household income, the percent graduating college, and the predicted percent to graduate college.
Exercise A.47
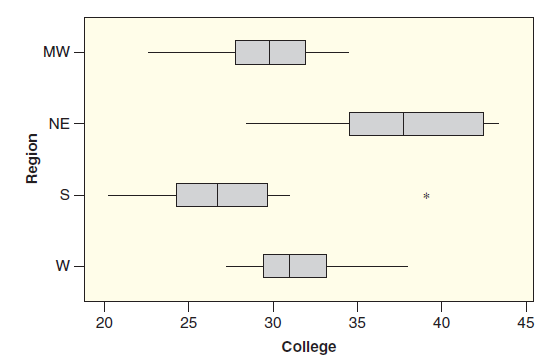
The dataset US States includes information on the percent of the population to graduate from college (of those age 25 and older) for each US state. Figure A.7 shows side-by-side boxplots for percent of college graduates by region of the country (Midwest, Northeast, South, and West.)
Figure A.7
Step by Step Answer:
a There is a strong linear positive trend with no obvious out...View the full answer


Statistics Unlocking The Power Of Data
ISBN: 9780470601877
1st Edition
Authors: Robin H. Lock, Patti Frazer Lock, Kari Lock Morgan, Eric F. Lock, Dennis F. Lock
