

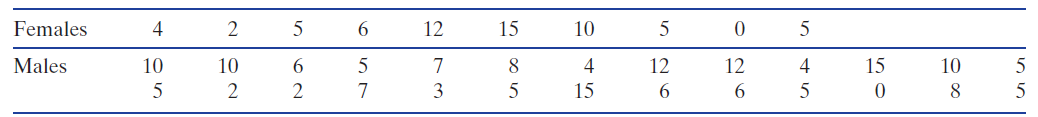
In the StudentSurvey data, there are 36 seniors: 26 males and 10 females. Table C.9 gives the
Question:
Table C.9
Fantastic news! We've Found the answer you've been seeking!
Step by Step Answer:
We estimate f m where f represents the mean time spent exerc...View the full answer

Answered By
Bhartendu Goyal
Professional, Experienced, and Expert tutor who will provide speedy and to-the-point solutions. I have been teaching students for 5 years now in different subjects and it's truly been one of the most rewarding experiences of my life. I have also done one-to-one tutoring with 100+ students and help them achieve great subject knowledge. I have expertise in computer subjects like C++, C, Java, and Python programming and other computer Science related fields. Many of my student's parents message me that your lessons improved their children's grades and this is the best only thing you want as a tea...
2+ Reviews
10+ Question Solved
Related Book For 

Statistics Unlocking The Power Of Data
ISBN: 9780470601877
1st Edition
Authors: Robin H. Lock, Patti Frazer Lock, Kari Lock Morgan, Eric F. Lock, Dennis F. Lock
Question Posted:
