

Refer to Figure 4.16, which shows a randomization distribution for hypotheses H 0 : μ 1 =
Question:
xÌ…1 =17.3, xÌ…2 =18.7 or xÌ…1 = 19.0, xÌ…2 = 15.4
Figure 4.16
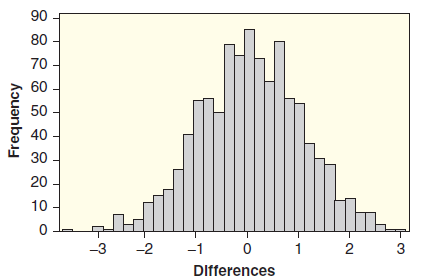
(a) For each D-value, sketch a smooth curve to roughly approximate the distribution in Figure 4.16, mark the D-value on the horizontal axis, and shade in the proportion of area corresponding to the p-value.
(b) Which sample provides the strongest evidence against H0? Why?
The word "distribution" has several meanings in the financial world, most of them pertaining to the payment of assets from a fund, account, or individual security to an investor or beneficiary. Retirement account distributions are among the most...
Fantastic news! We've Found the answer you've been seeking!
Step by Step Answer:
a We compute the difference in means D x 1 x 2 173 187 14 and D x 1 x 2 190 1...View the full answer

Answered By
Danish Sohail
My objective is to become most reliable expert for clients. For last 10 years I have been associated with the field of accounting and finance. My aim is to strive for best results and pay particular attention to client needs. I am always enthusiastic to help clients for issues and concerns related to business studies. I can work on analysis of the financial statements, calculate different ratios and analysis of ratios. I can critically evaluate stock prices based on the financial analysis and valuation for companies using financial statements of the business entity being valued with use of excel tools. I have expertise to provide effective and reliable help for projects in corporate finance, equity investments, financial accounting, cost accounting, financial planning, business plans, marketing plans, performance measurement, budgeting, economic research, risk assessment, risk management, derivatives, fixed income investments, taxation, auditing, and financial performance analysis.
78+ Reviews
112+ Question Solved
Related Book For 

Statistics Unlocking The Power Of Data
ISBN: 9780470601877
1st Edition
Authors: Robin H. Lock, Patti Frazer Lock, Kari Lock Morgan, Eric F. Lock, Dennis F. Lock
Question Posted:
