

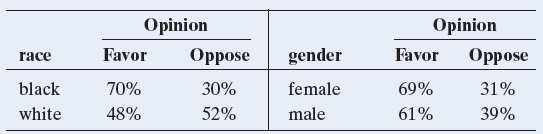
Table 11.10, summarized again here, showed the associations between death penalty opinion and gender or race. a.
Question:
a. True or false: The table with the larger X2 statistic necessarily has the stronger association. Explain.
b. To make an inference about the strength of association in the population, you can construct confidence intervals around the sample differences of proportions. The 95% confidence intervals are (0.15, 0.28) comparing whites and blacks and (0.04, 0.12) comparing males and females. In the population, can you make a conclusion about which variable is more strongly associated with the death penalty opinion? Explain.
Fantastic news! We've Found the answer you've been seeking!
Step by Step Answer:
a False a larger chisquared value might be due to a larg...View the full answer

Answered By
YOGENDRA NAILWAL
As I'm a Ph.D. student, so I'm more focussed on my chemistry laboratory. I have qualified two national level exams viz, GATE, and NET JRF (Rank 68). So I'm highly qualified in chemistry subject. Also, I have two years of teaching experience in this subject, which includes college teacher as well as a personal tutor. I can assure you if you hire me on this particular subject, you are never going to regret it.
Best Regards.
1+ Reviews
10+ Question Solved
Related Book For 

Statistics The Art And Science Of Learning From Data
ISBN: 9780321997838
4th Edition
Authors: Alan Agresti, Christine A. Franklin, Bernhard Klingenberg
Question Posted:
