

Table 3.4 on page 174 shows the number of points scored and penalty minutes for 24 ice
Question:
Table 3.4
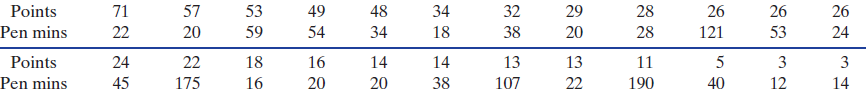
(a) Create a dotplot of the distribution of penalty minutes (PenMin) for the original sample of 24 players. Comment on the shape, paying particular attention to skewness and possible outliers.
(b) Find the mean and standard deviation of the penalty minute values for the original sample.
(c) Use StatKey or other technology to construct a bootstrap distribution for the mean penalty minutes for samples of size n = 24 NHL players. Comment on the shape of this distribution, especially compared to the shape of the original sample.
(d) Compute the standard deviation of the bootstrap means using the distribution in part (c). Compare this value to the standard deviation of the penalty minutes in the original sample.
(e) Construct an interval estimate for the mean penalty minutes of NHL players.
(f) Give a reason why it might not be reasonable to use the players on one team as a sample of all players in a league.
The word "distribution" has several meanings in the financial world, most of them pertaining to the payment of assets from a fund, account, or individual security to an investor or beneficiary. Retirement account distributions are among the most...
Step by Step Answer:
a The original sample is rightskewed with outliers at 107 121 175 an...View the full answer


Statistics Unlocking The Power Of Data
ISBN: 9780470601877
1st Edition
Authors: Robin H. Lock, Patti Frazer Lock, Kari Lock Morgan, Eric F. Lock, Dennis F. Lock
