

Table C.13 gives systolic blood pressure readings (first introduced in Exercise A.36 on page 150) for Intensive
Question:
Table C.13
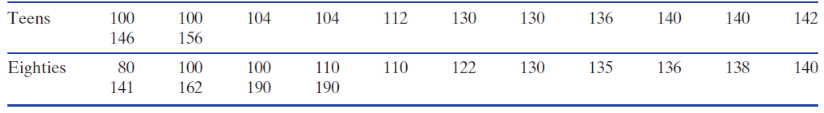
(a) Find and interpret a 95% confidence interval for the mean systolic blood pressure for each group. Which has a larger margin of error? What aspect of the data is the cause of that larger margin of error?
(b) Test to see if there is a difference in systolic blood pressure readings between ICU patients in their teens and those in their eighties.
Exercise A.36
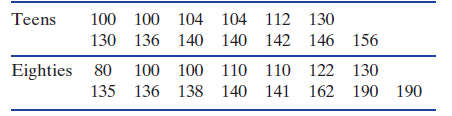
How does the variability in systolic blood pressure compare between ICU patients in their teens and those in their eighties for the patients in the dataset ICUAdmissions? The values for each group are given in Table A.8. Use technology to find the five number summary, the range and IQR, and the standard deviation in each case and compare the measures of spread for the two groups.
Table A.8
Step by Step Answer:
While there are some possible outliers in the 80s age range they are not extreme and otherwise the d...View the full answer


Statistics Unlocking The Power Of Data
ISBN: 9780470601877
1st Edition
Authors: Robin H. Lock, Patti Frazer Lock, Kari Lock Morgan, Eric F. Lock, Dennis F. Lock
