

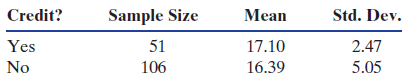
Table C.2 gives summary statistics for the tip percentage based on whether or not a credit card
Question:
Table C.2
Refer to the dataset RestaurantTips. The data were introduced in Data 2.12 on page 119, and include information from a sample of 157 restaurant bills collected at the First Crush bistro.
Data 2.12 on page 119
The owner of a bistro called First Crush in Potsdam, New York, is interested in studying the tipping patterns of its patrons. He collected restaurant bills over a two-week period that he believes provide a good sample of his customers. The data from 157 bills are stored in RestaurantTips and include the amount of the bill, size of the tip, percentage tip, number of customers in the group, whether or not a credit card was used, day of the week, and a coded identity of the server.

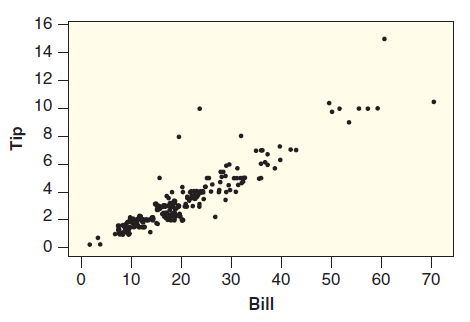
For the restaurant tips data, we want to use the bill amount to predict the tip amount, so the explanatory variable is the amount of the bill and the response variable is the amount of the tip. A scatterplot of this relationship is shown in Figure 2.63.
Step by Step Answer:
Paying with a credit or debit card has a larger average tip percentage in the sample x Y 1710 x N ...View the full answer


Statistics Unlocking The Power Of Data
ISBN: 9780470601877
1st Edition
Authors: Robin H. Lock, Patti Frazer Lock, Kari Lock Morgan, Eric F. Lock, Dennis F. Lock
