

Table D.12 shows the number of boys diagnosed with ADHD based on the quarter of the year
Question:
Table D.12
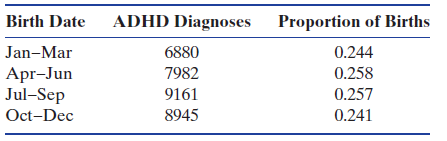
(a) What is the total number of boys diagnosed with ADHD in the sample?
(b) For the null hypothesis, use the overall proportion of births in a quarter to give the null proportion for that quarter. Compute the expected number of ADHD diagnoses for each quarter under this hypothesis.
(c) Compute the χ2-statistic.
(d) Give the degrees of freedom and find the p-value.
(e) State the conclusion of the test. For which group of children does ADHD appear to be diagnosed more frequently than we would expect? Less frequently? Write a sentence explaining what this means about ADHD and relative age in school.
A new study indicates that the youngest children in a school grade are more likely to be diagnosed with attention-deficit/hyperactivity disorder (ADHD) than their older peers in the same grade. The study involved 937,943 children between 6 and 12 years old in British Columbia, Canada. The cutoff date for entering school in any year in British Columbia is December 31, so in any given class, those born late in the year are almost a year younger than those born early in the year. Is it possible that the younger students are being over-diagnosed with ADHD?
Step by Step Answer:
This is a chisquare goodnessoffit test a We see that the number of boys diagnosed with ADHD is 6880 ...View the full answer


Statistics Unlocking The Power Of Data
ISBN: 9780470601877
1st Edition
Authors: Robin H. Lock, Patti Frazer Lock, Kari Lock Morgan, Eric F. Lock, Dennis F. Lock
