

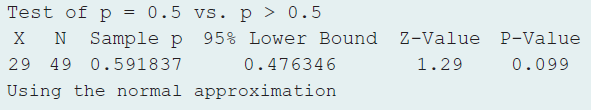
The 49 students in a class at the University of Florida made blinded evaluations of pairs of
Question:
Test and CI for One Proportion
Test and CI for One Proportion
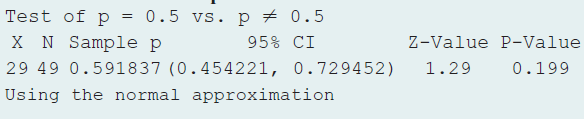
a. Explain how to get the test statistic value that MINITAB reports.
b. Explain how to get the P-value. Interpret it.
c. Based on the result in part b, does it make sense to accept H0? Explain.
d. What does the 95% confidence interval tell you that the test does not?
Fantastic news! We've Found the answer you've been seeking!
Step by Step Answer:
a The test statistic ZValue is calculated by taking the difference between the sample proportion and ...View the full answer

Answered By
Carly Cimino
As a tutor, my focus is to help communicate and break down difficult concepts in a way that allows students greater accessibility and comprehension to their course material. I love helping others develop a sense of personal confidence and curiosity, and I'm looking forward to the chance to interact and work with you professionally and better your academic grades.
12+ Reviews
21+ Question Solved
Related Book For 

Statistics The Art And Science Of Learning From Data
ISBN: 9780321997838
4th Edition
Authors: Alan Agresti, Christine A. Franklin, Bernhard Klingenberg
Question Posted:
