

The contingency table shown relates happiness and gender for the 2012 GSS. a. Identify the response variable
Question:
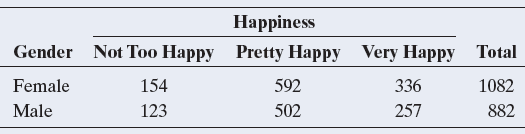
a. Identify the response variable and the explanatory variable.
b. Construct a table or graph showing the conditional distributions. Interpret.
c. Give an example of population conditional distributions (i.e., proportions or percentages) that would seem to be consistent with this sample and for which happiness and gender would be independent.
Fantastic news! We've Found the answer you've been seeking!
Step by Step Answer:
a The response variable is happiness and the explanat...View the full answer

Answered By
Susan Juma
I'm available and reachable 24/7. I have high experience in helping students with their assignments, proposals, and dissertations. Most importantly, I'm a professional accountant and I can handle all kinds of accounting and finance problems.
15+ Reviews
45+ Question Solved
Related Book For 

Statistics The Art And Science Of Learning From Data
ISBN: 9780321997838
4th Edition
Authors: Alan Agresti, Christine A. Franklin, Bernhard Klingenberg
Question Posted:
