

The dataset StudentSurvey has information from males and females on the number of hours spent watching television
Question:
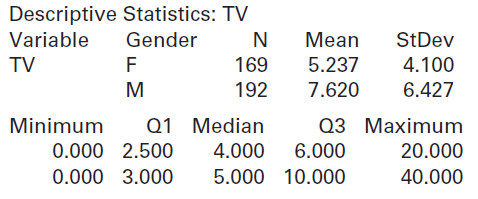
(a) In the sample, which group watches more TV, on average? By how much?
(b) Use the summary statistics to compute a 99% confidence interval for the difference in mean number of hours spent exercising. Be sure to define any parameters you are estimating.
(c) Compare the answer from part (c) to the confidence interval given in the following computer output for the same data:
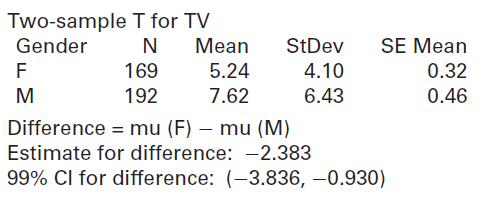
(d) Interpret the confidence interval in context.
Fantastic news! We've Found the answer you've been seeking!
Step by Step Answer:
a The males watch more TV with a mean in this sample of 7620 compared to the female mean of 5237 The ...View the full answer

Answered By
Vijesh J
My passion to become a tutor is a lifetime milestone. Being a finance and marketing professional with hands-on experience in wealth management, portfolio management, team handling and actively contributing in promoting the company. Highly talented in managing and educating students in most attractive ways were students get involved. I will always give perfection to my works. Time is the most important for the works and I provide every answer on time without a delay. I will proofread each and every work and will deliver a with more perfection.
5+ Reviews
15+ Question Solved
Related Book For 

Statistics Unlocking The Power Of Data
ISBN: 9780470601877
1st Edition
Authors: Robin H. Lock, Patti Frazer Lock, Kari Lock Morgan, Eric F. Lock, Dennis F. Lock
Question Posted:
