

The mice in the study had body mass measured throughout the study. Computer output showing body mass
Question:
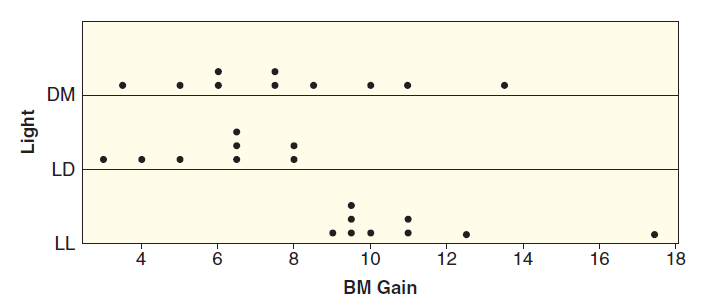
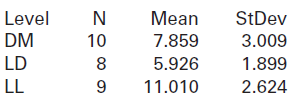
(a) In the sample, which group of mice gained the most, on average, over the four weeks? Which gained the least?
(b) Do the data appear to meet the requirement of having standard deviations that are not dramatically different?
(c) The sample sizes are small, so we check that the data are relatively normally distributed. We see in Figure 8.6 that we have no concerns about the DM and LD samples. However, there is an outlier for the LL sample, at 17.4 grams. We proceed as long as the z-score for this value is within ±3. Find the z-score. Is it appropriate to proceed with ANOVA?
(d) What are the cases in this analysis? What are the relevant variables? Are the variables categorical or quantitative?
Studies have shown that exposure to light at night is harmful to human health. Data A.1 on page 136 introduces a study in mice showing that even low-level light at night can interfere with normal eating and sleeping cycles and can have an effect on weight gain and glucose intolerance. In the study, mice were randomly assigned to live in one of three light conditions: LD had a standard light/dark cycle, LL had bright light all the time, and DM had dim light when there normally would have been darkness.
Data A.1 on page 136
Numerous studies have shown that exposure to light at night is harmful to human health. A recent study in mice shows that even low-level light at night can interfere with normal eating and sleeping cycles. Furthermore, the study finds that food is especially fattening if consumed at the wrong time of day, at least in mice. In the study, 27 mice were randomly split into three groups. One group was on a normal light€“dark cycle (LD), one group had bright light on all the time (LL), and one group had light during the day and dim light at night (DM). The dim light was equivalent to having a television set on in a room. The mice in darkness ate most of their food during their active (nighttime) period, matching the behavior of mice in the wild. The mice in both dim light and bright light, however, consumed more than half of their food during the well-lit rest period, when most mice are sleeping. Although the data collected show that the three groups of mice ate approximately the same amount of food and had the same levels of physical activity, the mice exposed to light at night gained substantially more weight, ate a greater percent of calories during the day, and were more likely to be classified as glucose intolerant at the end of the study. An absence of darkness seems to be associated with fatter mice.
Step by Step Answer:
a The mice in bright light gained the most x LL 1101 whil...View the full answer


Statistics Unlocking The Power Of Data
ISBN: 9780470601877
1st Edition
Authors: Robin H. Lock, Patti Frazer Lock, Kari Lock Morgan, Eric F. Lock, Dennis F. Lock
