

The StudentSurvey dataset includes information on the number of hours a week students say they exercise and
Question:
(a) What would a positive relationship between these two variables imply about the way students spend their time? What would a negative relationship imply?
(b) For each corner of the scatterplot of these two variables shown in Figure 2.60 (top left, top right, bottom left, bottom right), describe a student whose daily habits place him or her in that corner.
Figure 2.60
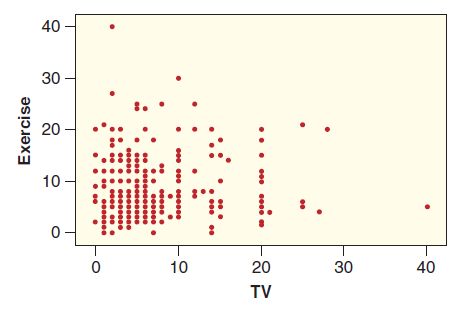 (c) There are two outliers in this scatterplot. Describe the student corresponding to the outlier on the right. Describe the student corresponding to the outlier on the top.
(d) The correlation between these two variables is r = 0.01. What does this correlation tell you about the strength of a linear relationship between these two variables?
Fantastic news! We've Found the answer you've been seeking!
Step by Step Answer:
a A positive relationship would imply that a student who exercises lots also watches lots of televis...View the full answer

Answered By
Pushpinder Singh
Currently, I am PhD scholar with Indian Statistical problem, working in applied statistics and real life data problems. I have done several projects in Statistics especially Time Series data analysis, Regression Techniques.
I am Master in Statistics from Indian Institute of Technology, Kanpur.
I have been teaching students for various University entrance exams and passing grades in Graduation and Post-Graduation.I have expertise in solving problems in Statistics for more than 2 years now.I am a subject expert in Statistics with Assignmentpedia.com.
3+ Reviews
10+ Question Solved
Related Book For 

Statistics Unlocking The Power Of Data
ISBN: 9780470601877
1st Edition
Authors: Robin H. Lock, Patti Frazer Lock, Kari Lock Morgan, Eric F. Lock, Dennis F. Lock
Question Posted:
