

The table refers to a survey of senior high school students in Dayton, Ohio. It cross-tabulates whether
Question:
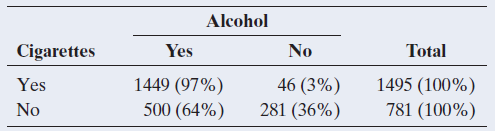
a. Describe the strength of association by using the difference between users and nonusers of cigarettes in the proportions who have used alcohol. Interpret.
b. Describe the strength of association by using the relative risk of using alcohol, comparing those who have used or not used cigarettes. Interpret.
c. Find the odds of having used alcohol for users and nonusers of cigarettes. Interpret each. Then, describe the strength of association, using the odds ratio.
Fantastic news! We've Found the answer you've been seeking!
Step by Step Answer:
a 64 of those who had not smoked cigarettes also used alcohol whereas 97 of those ...View the full answer

Answered By
PU Student
cost accounting
financial accounting
auditing
internal control
business analyst
tax
i have 3 years experience in field of management & auditing in different multinational firms. i also have 16 months experience as an accountant in different international firms. secondary school certification.
higher secondary school certification.
bachelors in mathematics.
cost & management accountant
4+ Reviews
10+ Question Solved
Related Book For 

Statistics The Art And Science Of Learning From Data
ISBN: 9780321997838
4th Edition
Authors: Alan Agresti, Christine A. Franklin, Bernhard Klingenberg
Question Posted:
