

The table shows 2012 GSS data on marital and general happiness for married respondents. a. The chi-squared
Question:
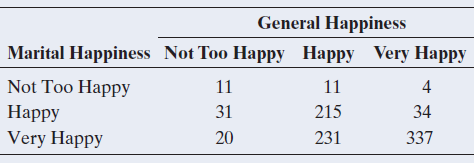
a. The chi-squared test of independence has X2 = 214. What conclusion would you make using a significance level of 0.05? Interpret.
b. Does this large chi-squared value imply there is a strong association between marital and general happiness? Explain.
c. Find the difference in the proportion of being not too happy between those that are not too happy in their marriage and those that are very happy in their marriage. Interpret that difference.
d. Find and interpret the relative risk of being not too happy, comparing the lowest and highest marital happiness group. Interpret.
Fantastic news! We've Found the answer you've been seeking!
Step by Step Answer:
a Since the Pvalue is less than 0001 there is strong eviden...View the full answer

Answered By
PALASH JHANWAR
I am a Chartered Accountant with AIR 45 in CA - IPCC. I am a Merit Holder ( B.Com ). The following is my educational details.
PLEASE ACCESS MY RESUME FROM THE FOLLOWING LINK: https://drive.google.com/file/d/1hYR1uch-ff6MRC_cDB07K6VqY9kQ3SFL/view?usp=sharing
3+ Reviews
10+ Question Solved
Related Book For 

Statistics The Art And Science Of Learning From Data
ISBN: 9780321997838
4th Edition
Authors: Alan Agresti, Christine A. Franklin, Bernhard Klingenberg
Question Posted:
