

The table shows the 2012 GSS data on gender and political party identification from Exercise 11.1. (The
Question:
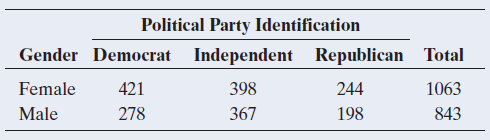
a. Estimate the difference between females and males in the proportion who identify themselves as Republicans. Interpret.
b. Estimate the difference between females and males in the proportion who identify themselves as Democrat. Interpret.
c. Estimate the ratio between females and males in the proportion who identify themselves as Republican. Interpret.
d. Estimate the ratio between females and males in the proportion who identify themselves as Democrat. Interpret.
e. What can you say about the strength of the association between gender and whether identifying as Republican? What about gender and whether identifying as Democrat?
Fantastic news! We've Found the answer you've been seeking!
Step by Step Answer:
a The proportion of females who identify as Republican is 2441063 198...View the full answer

Answered By
Hillary Waliaulah
As a tutor, I am that experienced with over 5 years. With this, I am capable of handling a variety of subjects.
17+ Reviews
30+ Question Solved
Related Book For 

Statistics The Art And Science Of Learning From Data
ISBN: 9780321997838
4th Edition
Authors: Alan Agresti, Christine A. Franklin, Bernhard Klingenberg
Question Posted:
