

Throughout Unit C we examined various relationships between the variables regarding houses for sale in the dataset
Question:
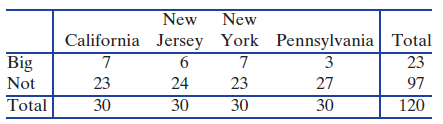
Table 7.28
Fantastic news! We've Found the answer you've been seeking!
Step by Step Answer:
We test H 0 Home size is not related to state vs H a Home si...View the full answer

Answered By
ALBANUS MUTUKU
If you are looking for exceptional academic and non-academic work feel free to consider my expertise and you will not regret. I have enough experience working in the freelancing industry hence the unmistakable quality service delivery
178+ Reviews
335+ Question Solved
Related Book For 

Statistics Unlocking The Power Of Data
ISBN: 9780470601877
1st Edition
Authors: Robin H. Lock, Patti Frazer Lock, Kari Lock Morgan, Eric F. Lock, Dennis F. Lock
Question Posted:
