

Use Fishers LSD, as described in Exercise 8.50, to discuss differences in mean time mice spend in
Question:
Exercise 8.49
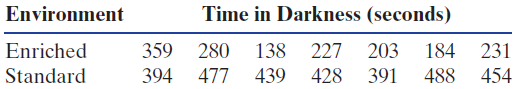
Many studies have shown that people who engage in any exercise have improved mental health over those that never exercise. In particular, even a small amount of exercise seems to confer some resilience to stress. Most of these studies, by necessity, have been observational studies. A recent experiment with mice moves us one step closer to determining a causal association. In the study, mice were randomly assigned to either an enriched environment (EE) where there was an exercise wheel available or a standard environment (SE) with no exercise options. After three weeks in the specified environment, for five minutes a day for two weeks, the mice were each exposed to a €˜€˜mouse bully€€”a mouse that was very strong, aggressive, and territorial. At the end of the two weeks, the mice in the SE group exhibited maladaptive, depressive-like, and anxietylike behavior across a wide spectrum of activities. This was not true of the mice in the EE group; they behaved similarly to mice that had never had the stress-inducing bully experience. In particular, one measure of mouse anxiety is amount of time hiding in a dark compartment, with mice that are more anxious spending more time in darkness. The amount of time spent in darkness during one trial is recorded for all the mice and is shown in Table 6.22 and available in StressedMice. Test to see if mice that have spent time in an enriched environment with options for exercise spend significantly less time in darkness after a stress-inducing experience.
Table 6.22
Exercise 8.50
One way to €˜€˜automate€ pairwise comparisons that works particularly well when the sample sizes are balanced is to compute a single value that can serve as a threshold for when a pair of sample means are far enough apart to suggest that the population means differ between those two groups. One such value is called Fisher€™s Least Significant Difference or LSD for short.
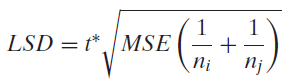
You may recognize this as the margin of error for a confidence interval for a difference in two means after doing an ANOVA. That is exactly how we compute it. Recall that the test for a pair of means will show a significant difference exactly when the confidence interval fails to include zero. The confidence level should be matched to the significance level of the test (for example, a 95% confidence interval corresponds to a 5% significance level). If the difference in two group means (in absolute value) is smaller than the LSD margin of error, the confidence interval will have one positive and one negative endpoint. Otherwise, the interval will stay either all positive or all negative and we conclude
Reject H0 and conclude
the two means differ ‡‡’ |xÌ…i ˆ’ xÌ…j| > LSD
Compute LSD using a 5% significance level for the ANOVA data comparing textbook costs in Example 8.10 on page 516. Use the value to determine which academic fields appear to show evidence of a difference in mean textbook costs.
Step by Step Answer:
We have 25 degrees of freedom for the MSE 24699 so the tvalue for a ...View the full answer


Statistics Unlocking The Power Of Data
ISBN: 9780470601877
1st Edition
Authors: Robin H. Lock, Patti Frazer Lock, Kari Lock Morgan, Eric F. Lock, Dennis F. Lock
