

The following cost graphs illustrate various types of cost behavior: For each of the following costs, identify
Question:
The following cost graphs illustrate various types of cost behavior:
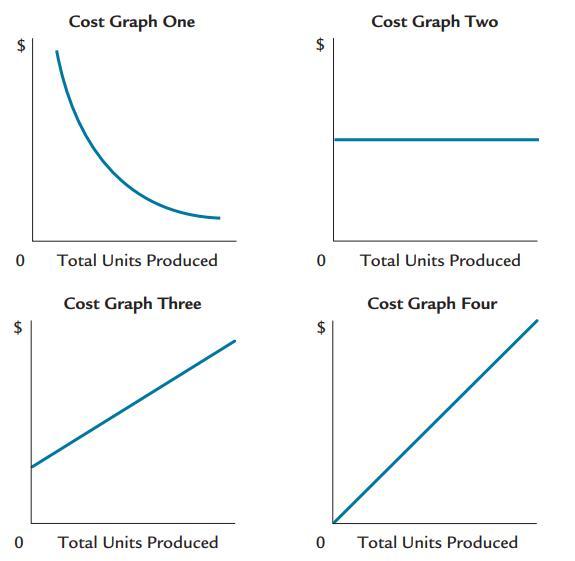
For each of the following costs, identify the cost graph that best illustrates its cost behavior as the number of units produced increases.
a. Direct material cost per unit.
b. Fees for using a patent of $250,000 plus $0.10 for each unit produced.
c. Salary of quality control supervisor.
d. Straight-line depreciation per unit on factory equipment.
e. Total direct materials cost.
Fantastic news! We've Found the answer you've been seeking!
Step by Step Answer:
a Graph Two ...View the full answer

Answered By
PALASH JHANWAR
I am a Chartered Accountant with AIR 45 in CA - IPCC. I am a Merit Holder ( B.Com ). The following is my educational details.
PLEASE ACCESS MY RESUME FROM THE FOLLOWING LINK: https://drive.google.com/file/d/1hYR1uch-ff6MRC_cDB07K6VqY9kQ3SFL/view?usp=sharing
3+ Reviews
10+ Question Solved
Related Book For 

Question Posted:
