

Consider the following graph, which shows the U.S. population in 2000 and the projected U.S. population in
Question:
Consider the following graph, which shows the U.S. population in 2000 and the projected U.S. population in 2050.
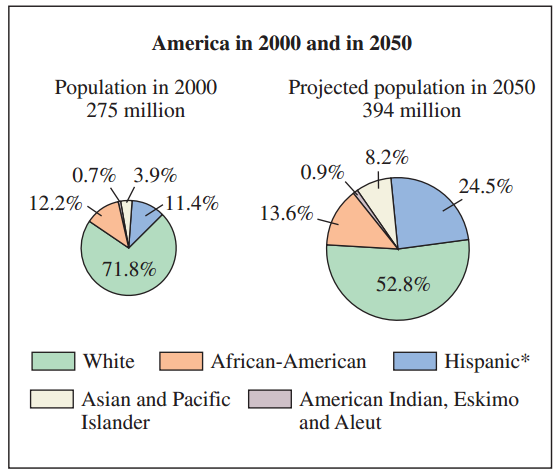
(a) Compute the projected percent increase in population from 2000 to 2050 by using the formula .
(b) Measure the radius and then compute the area of the circle representing 2000. Use A = πr2.
(c) Repeat part (b) for the circle representing 2050.
(d) Compute the percent increase in the size of the area of the circle from 2000 to 2050.
(e) Are the circle graphs misleading?
Fantastic news! We've Found the answer you've been seeking!
Step by Step Answer:
a b Radius 14 in 025 in A r 2 025 2 00625 0196349541 0196 in 2 c Rad...View the full answer

Answered By
Mugdha Sisodiya
My self Mugdha Sisodiya from Chhattisgarh India. I have completed my Bachelors degree in 2015 and My Master in Commerce degree in 2016. I am having expertise in Management, Cost and Finance Accounts. Further I have completed my Chartered Accountant and working as a Professional.
Since 2012 I am providing home tutions.
2+ Reviews
10+ Question Solved
Related Book For 

A Survey of Mathematics with Applications
ISBN: 978-0134112107
10th edition
Authors: Allen R. Angel, Christine D. Abbott, Dennis Runde
Question Posted:
