

The circle graph below shows the number of cups of coffee consumed per week by people in
Question:
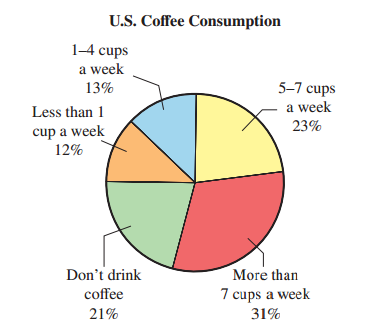
(a) Estimate the number of people surveyed who consume 5€“7 cups of coffee per week.
(b) Estimate the number of people surveyed who consume less than 1 cup of coffee per week.
(c) Estimate the number of people surveyed who don€™t drink coffee.
Fantastic news! We've Found the answer you've been seeking!
Step by Step Answer:
a 23 of 700 25 of 700 025 x 7...View the full answer

Answered By
Ashok Kumar Malhotra
Chartered Accountant - Accounting and Management Accounting for 15 years.
QuickBooks Online - Certified ProAdvisor (Advance - QuickBooks Online for 3 years.
3+ Reviews
10+ Question Solved
Related Book For 

A Survey of Mathematics with Applications
ISBN: 978-0134112107
10th edition
Authors: Allen R. Angel, Christine D. Abbott, Dennis Runde
Question Posted:
