

The circle graph below shows the percent of Americans net monthly in-come spent on housing, transportation, food,
Question:
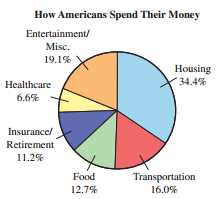
(a) How much more money per month does Sammy spend on entertainment/miscellaneous than on food?
(b) How much more money per month does Sammy spend on housing than on transportation?
Fantastic news! We've Found the answer you've been seeking!
Step by Step Answer:
a EntMisc 191 of 1950 0191 x 1950 37245 F...View the full answer

Answered By
Gauri Hendre
I worked as EI educator for Eduphy India YT channel. I gave online tutorials to the students who were living in the villages and wanted to study much more and were preparing for NEET, TET. I gave tutions for topics in Biotechnology. I am currently working as a tutor on course hero for the biochemistry, microbiology, biology, cell biology, genetics subjects. I worked as a project intern in BAIF where did analysis on diseases mainly genetic disorders in the bovine. I worked as a trainee in serum institute of India and Vasantdada sugar institute. I am working as a writer on Quora partner program from 2019. I writing on the topics on social health issues including current COVID-19 pandemic, different concepts in science discipline. I learned foreign languages such as german and french upto A1 level. I attended different conferences in the science discipline and did trainings in cognitive skills and personality development skills from Lila Poonawalla foundation. I have been the member of Lila poonawalla foundation since 2017. Even I acquired the skills like Excel spreadsheet, MS Office, MS Powerpoint and Data entry.
4+ Reviews
10+ Question Solved
Related Book For 

A Survey of Mathematics with Applications
ISBN: 978-0134112107
10th edition
Authors: Allen R. Angel, Christine D. Abbott, Dennis Runde
Question Posted:
